How to Use RQT for ROS Graph Introspection
The advanced guides are exclusively for ROS 1. We are actively working on updating these guides to also support ROS 2.
This tutorial is devoted to introspecting the ROS computation graph in RQT. But what is the rqt graph in the first place?
Prerequisites
RQT graph
RQT graph is a tool that comes in handy during your ROS development. It's based on the Qt framework.
The numerous rqt plugins the tool consists of will help you in ROS debugging and visualizing the computation graph.
When programming with ROS, you typically arrange your work into packages and nodes. As your application grows, your codebase does as well.
You'll be getting more and more nodes, with more and more communication between them (services, topics, actions). Also, you'll use already existing ROS nodes in your application, which is one of the advantages of ROS.
How to install rqt plugin
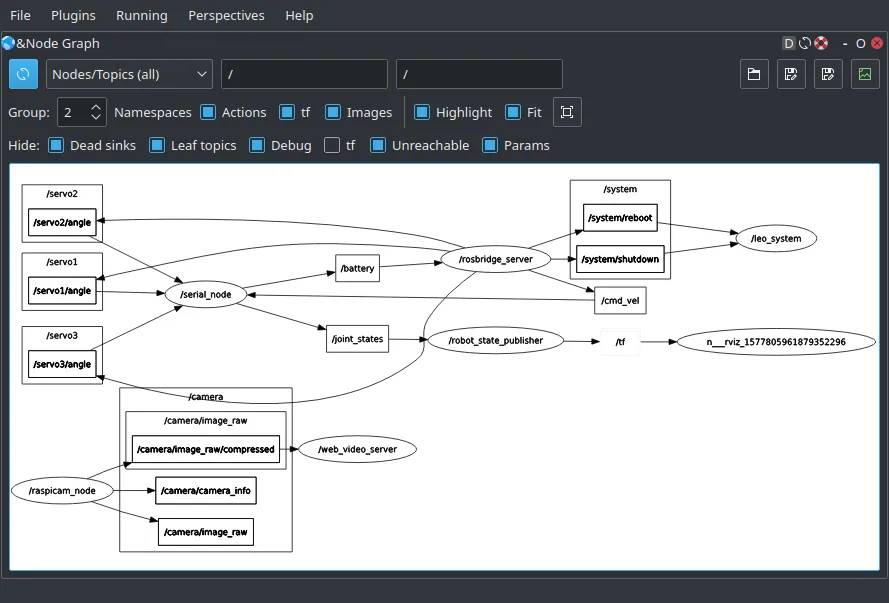
A node graph is an rqt plugin that can visualize ROS computation graph. It is a very handy tool for debugging communication problems.
First, make sure you have the plugin installed:
sudo apt update
sudo apt install ros-${ROS_DISTRO}-rqt-graph
Launching RQT
Start rqt by typing:
rqt
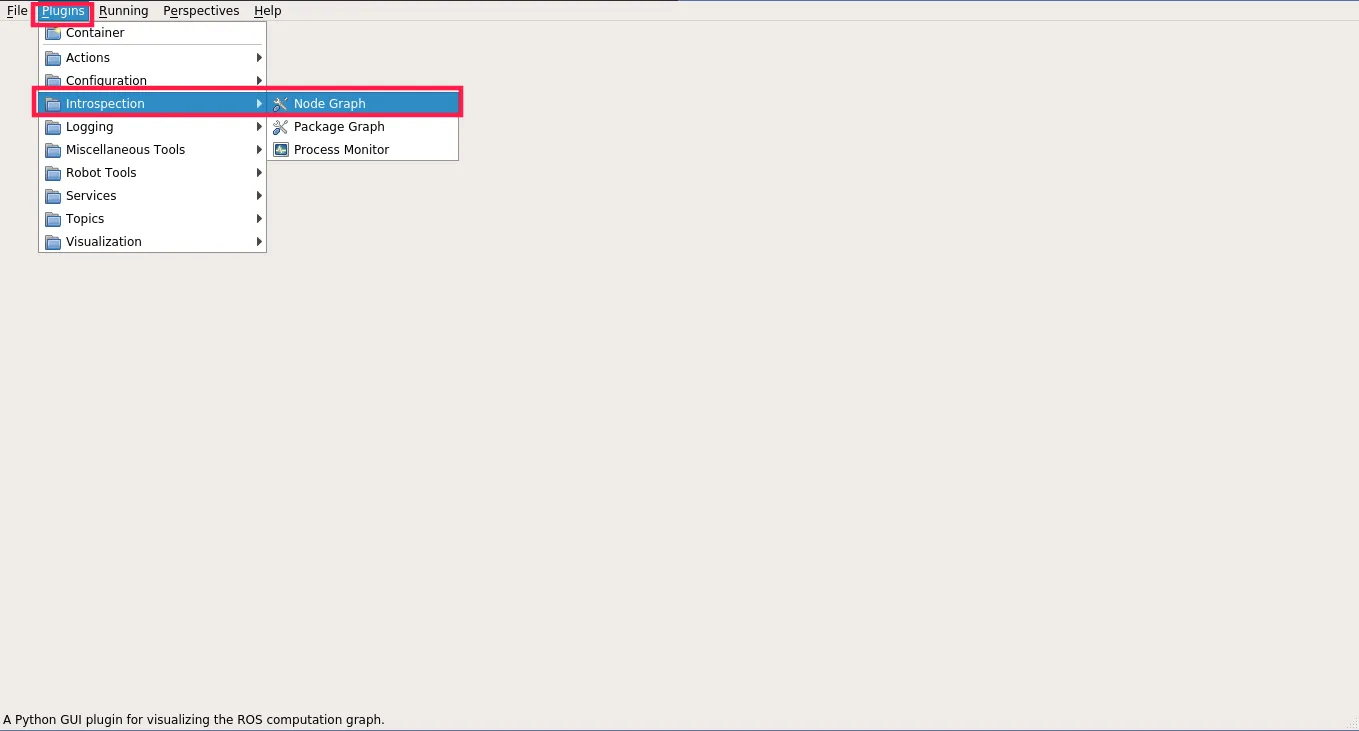
Now, choose Plugins -> Introspection -> Node Graph
If you are connected to your rover, you should see all the nodes running on Raspberry Pi. You can experiment with Node Graph settings, so it can look like this:
Rqt plot
Rgt_plot allows you to plot any numeric values that ROS topics publish and
have many plots within the same graph.
That's an excellent solution to visually keep track of the data created by a node or many nodes. For instance, it enables you to plot the speed/acceleration/position of your mobile base to check for a potential jerk and see if the trajectory is smooth. You could also monitor the data of the temperature sensor to see any increasing value, etc.